Visibility Score
Your Visibility Score is GrackerAI's headline metric - a single number (0–100) for how well AI search engines represent your brand across your monitored prompts. It sits at the top of your Visibility dashboard alongside seven supporting scores that show why it moved.
How the Visibility Score is calculated
Four signals feed into your Visibility Score. Improving any one of them moves the needle.
The 8 scores on your dashboard
The KPI row at the top of your Visibility dashboard shows eight scores. The first is the composite Visibility Score above; the rest break it down and add page-level health from Site Audit.
| Score | Range | What it measures |
|---|---|---|
| Visibility | 0–100 | Overall standing in AI answers - blends presence, prominence, sentiment, and citations (the four signals above). |
| Presence Rate | 0–100% | Share of tracked AI responses that mention your brand at all, regardless of position or tone. Your raw coverage. |
| SOV (Share of Voice) | 0–100% | Your share of all brand + competitor mentions. 100% means only your brand was named; 50% is an even split with competitors. |
| Citation Rate | 0–100% | Share of AI responses that cite a source supporting your brand - not just mentioning you, but pointing to evidence. |
| Sentiment | −100 to +100 | Average tone of your mentions: −100 very negative, 0 neutral, +100 very positive. |
| Avg Position | 0–100% (percentile) | Where your brand typically appears in a response. Lower is better - 0% = first, 100% = last. |
| AEO Audit | 0–100 | Average AEO Health across your audited pages in Site Audit - how well your pages are optimised for AI answer engines. Reads "No audited pages" until you run Site Audit. |
| Technical | 0–100 | Average Technical Health across your audited pages - Lighthouse performance, accessibility, best practices, and SEO. Also from Site Audit. |
Visibility Score Benchmarks
Rough guidance for interpreting the 0–100 Visibility Score - not thresholds the product enforces.
B2B SaaS companies in their first 90 days typically start at 0–10%. Cybersecurity vendors with established compliance content often start at 15–25%.
Why Scores Fluctuate
A 5–10 point weekly shift is normal. A 15+ point drop in 7 days warrants investigation.
- AI model updates - a new version of ChatGPT or Gemini can shift citations dramatically within a week
- Competitor content - major launches, funding rounds, or content drops shift the landscape
- Indexing lag - new content takes 1–4 weeks to propagate into AI responses
- Seasonal queries - compliance topics spike around audit cycles; security topics spike around breach disclosures
How to Improve Your Score
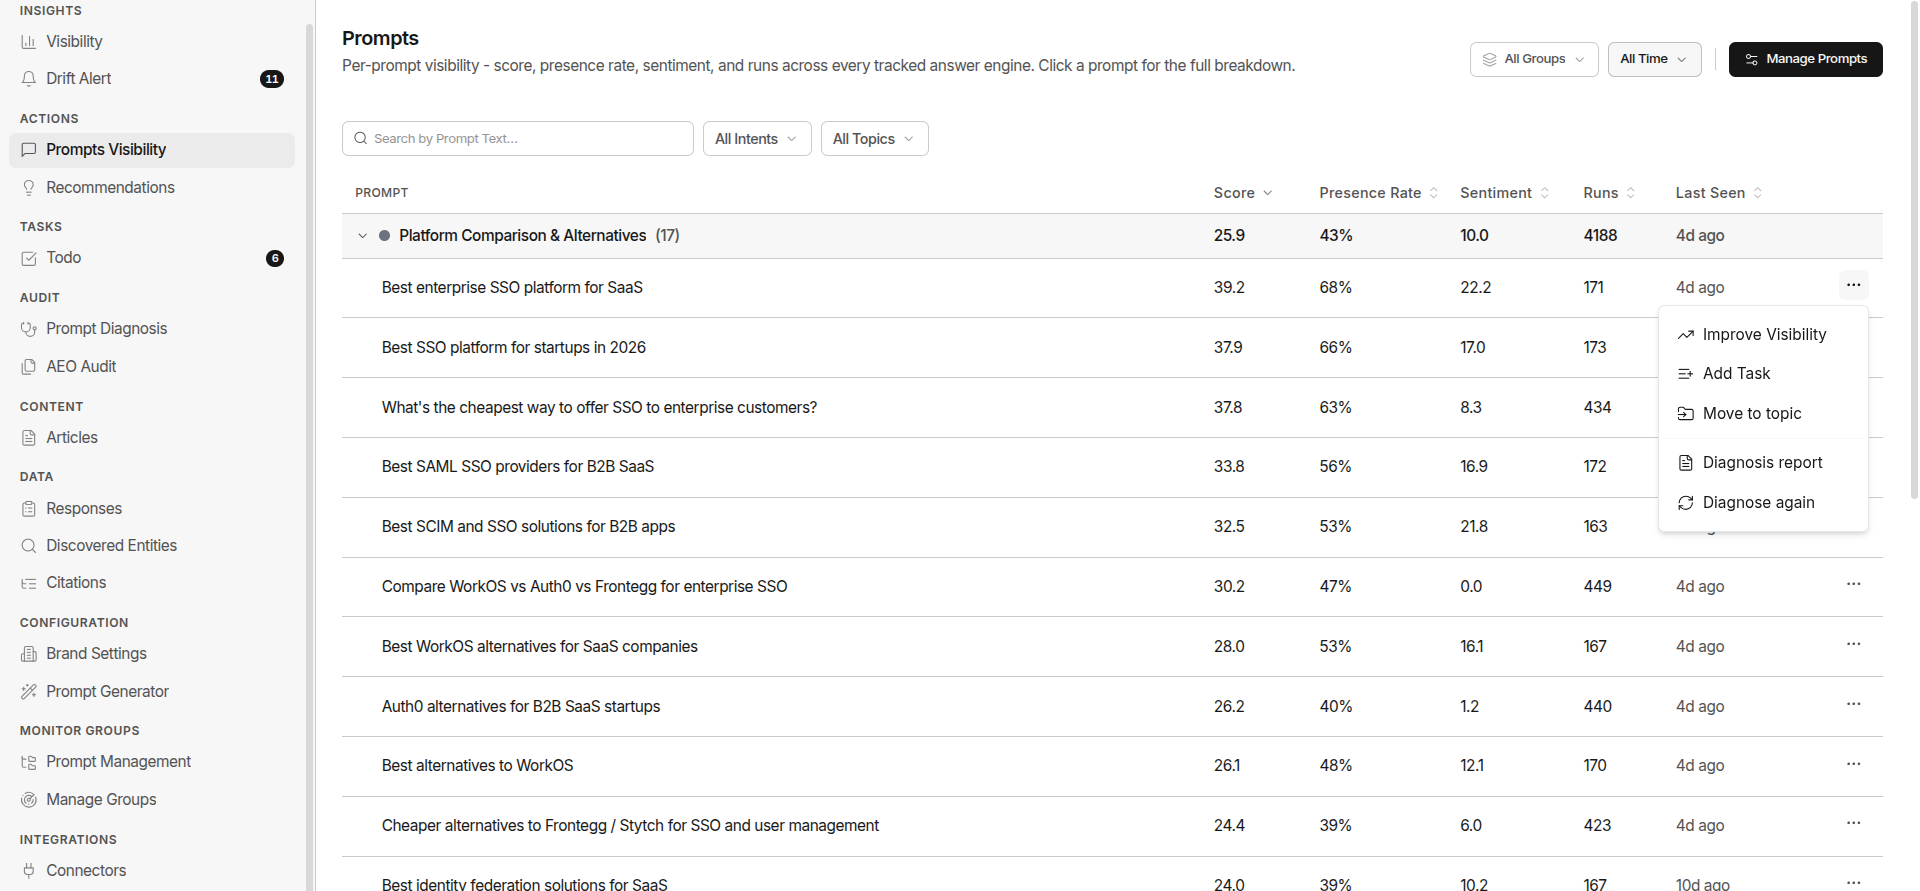
- Go to Actions → Prompts Visibility and sort by Score (low to high) - these are your biggest gaps
- Click into the worst-performing prompts and read the actual AI responses
- Identify what content is being cited instead of yours
- Create or improve content that matches what's winning (listicles, comparisons, deep technical guides)
- Earn placements on the cited domains your competitors are appearing on
- Re-check your scores in 4–6 weeks