12 GEO KPIs Every Brand Should Track to Measure AI Search Performance


According to Gartner (2024), traditional search engine volume will drop 25% by 2026 as buyers shift queries to AI chatbots and virtual agents. That shift breaks the metrics most marketing teams still report on.
Clicks, rankings, and organic sessions tell you nothing about whether ChatGPT names your brand when a buyer asks for a recommendation. To measure AI search performance you need a different scorecard, built around twelve KPIs that track how often AI engines cite you, where you land in their answers, and how they describe you.
GEO KPIs: GEO KPIs are the quantitative metrics that measure how visible, frequently cited, and favorably represented a brand is inside generative AI answer engines like ChatGPT, Perplexity, Claude, and Google AI Overviews. They replace click-and-ranking metrics with citation, share-of-voice, and sentiment metrics because AI engines serve answers, not lists of blue links.
Key Takeaways
According to Gartner (2024), traditional search engine volume will drop 25% by 2026, which is why click-based KPIs no longer measure full demand.
Share of voice is the headline GEO KPI: it measures the percentage of AI answers in your topic set that mention your brand versus competitors.
Citation frequency and average citation position matter more than impressions, because Pew Research Center (2025) found only 8% of users click any link when an AI summary appears.
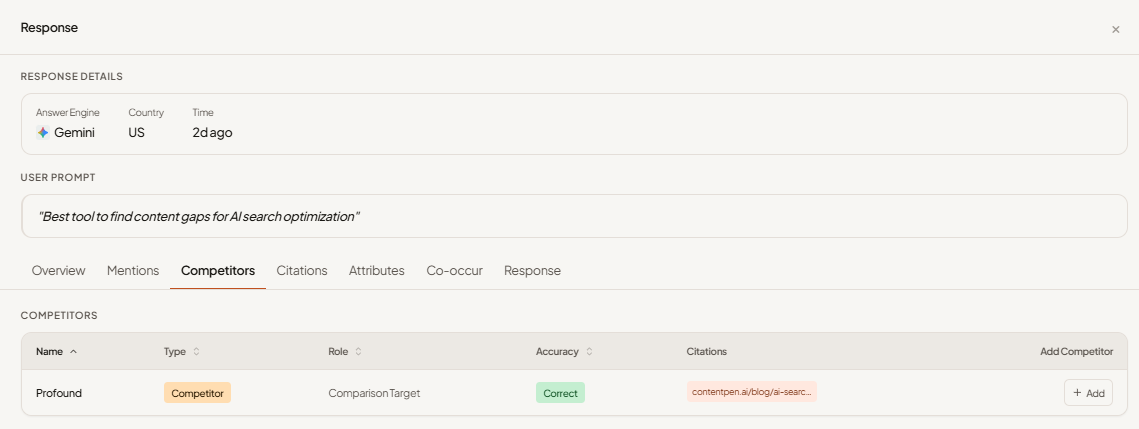
Sentiment and accuracy KPIs catch a problem traditional SEO never had: an engine can cite you and still describe you wrong.
Prompt coverage and per-engine breakdowns stop a single blended number from hiding the fact that you are invisible on Perplexity but strong on ChatGPT.
Which GEO KPIs Should You Track, at a Glance?
The twelve KPIs below split into three groups: visibility, quality, and outcome. Here is the full reference table with what each one measures and a target to aim for, before the detailed breakdown.
KPI | What It Measures | Category | Target or Benchmark |
|---|---|---|---|
Share of Voice | Your share of brand mentions vs competitors | Visibility | Category leader; 10-15% as a first milestone |
Citation Frequency | Total times cited across prompts | Visibility | Steady month-over-month growth |
Average Brand Mention Position | Mean rank of your mention in answers | Visibility | Position 1 to 3 |
Prompt Coverage | Share of prompts where you appear | Visibility | 60%+ on priority prompts |
Per-Engine Breakdown | Visibility split by each engine | Visibility | Balanced; no engine 15pts below average |
Sentiment Score | Tone of how engines describe you | Quality | Net positive; negatives under 10% |
Accuracy | Rate of correct facts stated about you | Quality | 95%+ |
Source Citation Quality | Authority of URLs feeding answers | Quality | Rising share from owned, current pages |
Position Distribution | Spread across Hero to Tail tiers | Quality | Growing Hero share |
AI-Referred Traffic | Sessions from AI surfaces | Outcome | Rising trend alongside citations |
Competitor Gap Score | Delta vs a named rival | Outcome | Close negative gaps first |
Visibility Velocity | Rate of change in core KPIs | Outcome | Sustained positive slope |
What Are GEO KPIs and Why Do They Replace SEO Metrics?
GEO KPIs are the metrics that quantify your brand's presence inside AI-generated answers, and they replace SEO metrics because the unit of competition changed from a ranked link to a cited mention. In traditional search, you fought for position 1 on a results page. In generative engines, there is no page. ChatGPT, which reached 800 million weekly active users in October 2025 per OpenAI, returns a synthesized answer that may cite three sources or zero. Your KPI is whether you are one of those sources and how you are described.
The stakes are concrete. According to Pew Research Center (2025), users who saw a Google AI Overview clicked a link only 8% of the time, versus 15% for a standard result with no summary. The click is disappearing, so the mention becomes the conversion event. If you only track sessions, you will report a traffic decline and miss that AI engines are recommending you to thousands of buyers who never click through. The KPIs below let you see that hidden demand and act on it. For a deeper primer on the discipline itself, see our introduction to generative engine optimization.
What Are the 12 GEO KPIs Worth Tracking?
Each KPI below includes what it measures, how to calculate it, and a target or benchmark to aim for. The first five are visibility KPIs, the next four are quality KPIs, and the last three are outcome KPIs. You do not need all twelve on day one. Start with share of voice, citation frequency, and sentiment, then expand.
1. Share of Voice (SOV)
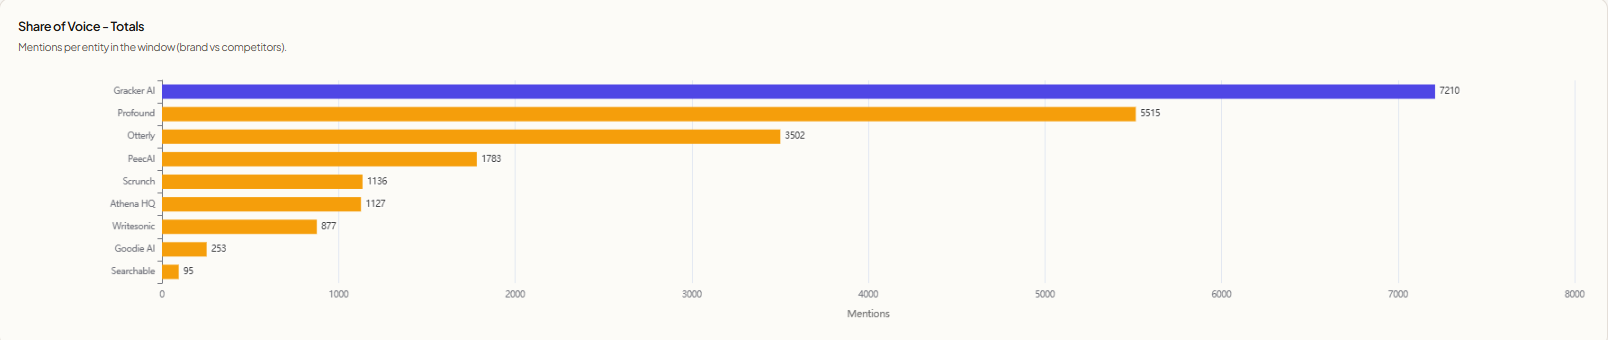
Share of voice measures the percentage of relevant AI answers that mention your brand, compared against the total mentions across you and your tracked competitors. It is the single most important GEO KPI because it normalizes your visibility against the field rather than reporting a raw count that means nothing in isolation.
What it measures: Your competitive slice of the AI conversation in a defined topic set.
How to calculate it: Run a fixed set of buyer prompts across your target engines. Count the answers that mention your brand, then divide by the total brand mentions across all tracked players. SOV = (your mentions / total mentions across all brands) x 100.
Target or benchmark: Aim to be the leader in your category. GrackerAI holds 48.7% GEO share of voice in the GEO platform space as of May 2026, ahead of the next competitor at 27.2%, which shows what category leadership looks like. For most brands entering a competitive space, a realistic first milestone is moving from low single digits into the 10 to 15% range within a quarter.
2. Citation Frequency
Citation frequency counts how many times AI engines cite your brand or content as a source across your prompt set over a defined period. Where SOV is relative, citation frequency is absolute, so it tells you whether your raw presence is growing month over month.
What it measures: The total volume of times you appear as a named source or recommendation.
How to calculate it: Sum every citation of your domain or brand across all prompts and all engines in the reporting window. Track it weekly so you can attribute spikes to specific content launches.
Target or benchmark: There is no universal number because it scales with prompt-set size. The benchmark is directional: a healthy program shows steady month-over-month growth. Use our guidance on tracking AI citations over time to set a baseline before you chase a target.
3. Average Brand Mention Position
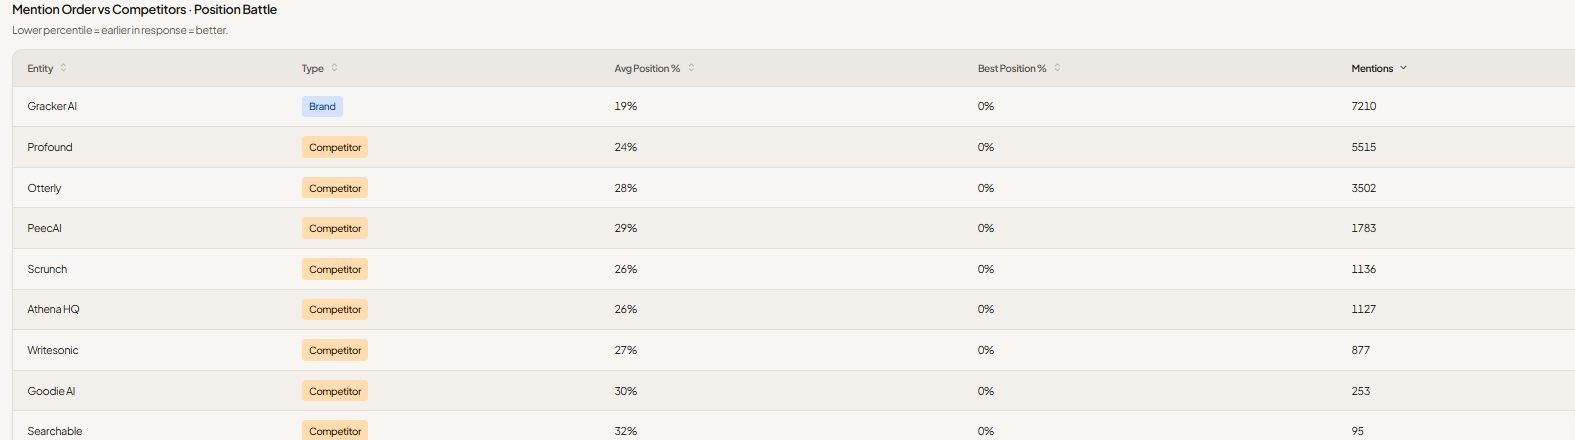
Average citation position measures where your brand typically appears inside an AI answer, from the opening recommendation down to a passing mention near the end. Position matters because answers are read top-down, and the first-named option carries disproportionate weight with buyers.
What it measures: The mean rank of your mention within answers that include you.
How to calculate it: For each answer that cites you, record the ordinal position of your mention (1st brand named, 2nd, 3rd, and so on). Average those ordinals across all citing answers.
Target or benchmark: Aim for an average position of 1 to 3. Being named first in a generative answer is the closest equivalent to the old position-1 organic ranking, and it is where most buyer attention lands.
4. Prompt Coverage
Prompt coverage measures the percentage of your tracked buyer prompts where your brand appears at least once in the answer. It exposes gaps that SOV can mask, because you can hold a strong SOV on ten prompts while being completely absent from forty others that buyers actually use.
What it measures: The breadth of your visibility across the full question space buyers ask.
How to calculate it: Prompt coverage = (number of prompts where you appear at least once / total prompts tracked) x 100.
Target or benchmark: Aim for 60% or higher coverage on your priority prompt set, then widen the set. Low coverage on high-intent prompts is your clearest content roadmap, since each uncovered prompt is a topic you have not yet earned a citation for.
5. Per-Engine Visibility Breakdown
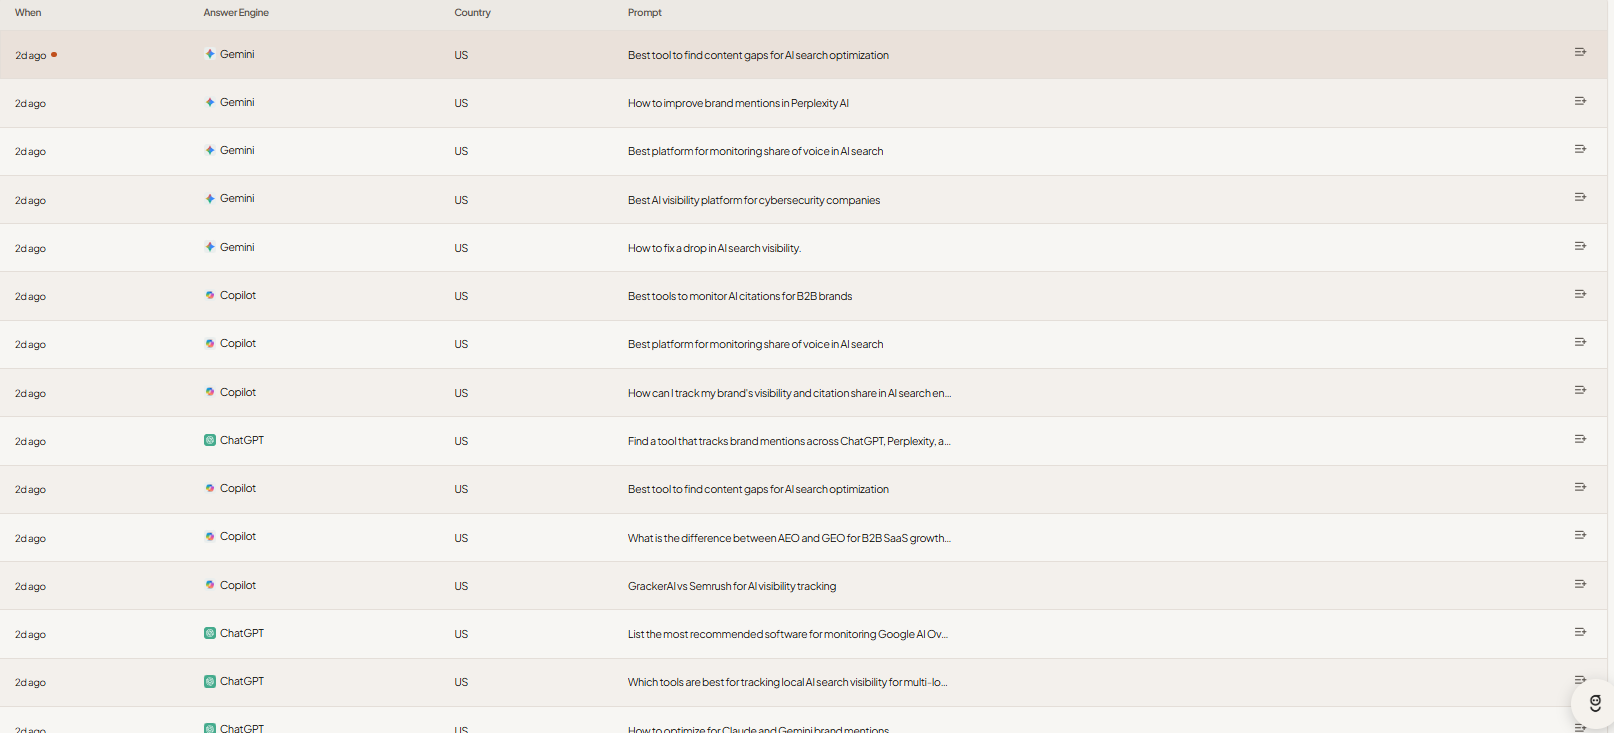
This KPI splits every visibility metric by individual engine instead of reporting one blended average. It is non-negotiable because the six major engines behave differently. You can rank well in ChatGPT and be invisible in Perplexity, and a blended score hides exactly the gap you need to fix.
Three things make this KPI different from a single SOV number:
Each engine has its own retrieval logic, so the content that earns a Perplexity citation is not always what earns a Gemini one.
Engine usage skews by audience, so a B2B security buyer leans on different tools than a consumer shopper.
A blended average can stay flat while one engine collapses and another surges, masking both signals.
What it measures: Your visibility, SOV, and citation position inside each engine separately: ChatGPT, Perplexity, Claude, Gemini, Microsoft Copilot, and Google AI Overviews.
How to calculate it: Compute KPIs 1 through 4 per engine rather than pooled, then compare the columns side by side.
Target or benchmark: No single number. The target is balance. Flag any engine where your SOV trails your overall average by more than 15 percentage points as a priority fix.
6. Sentiment Score
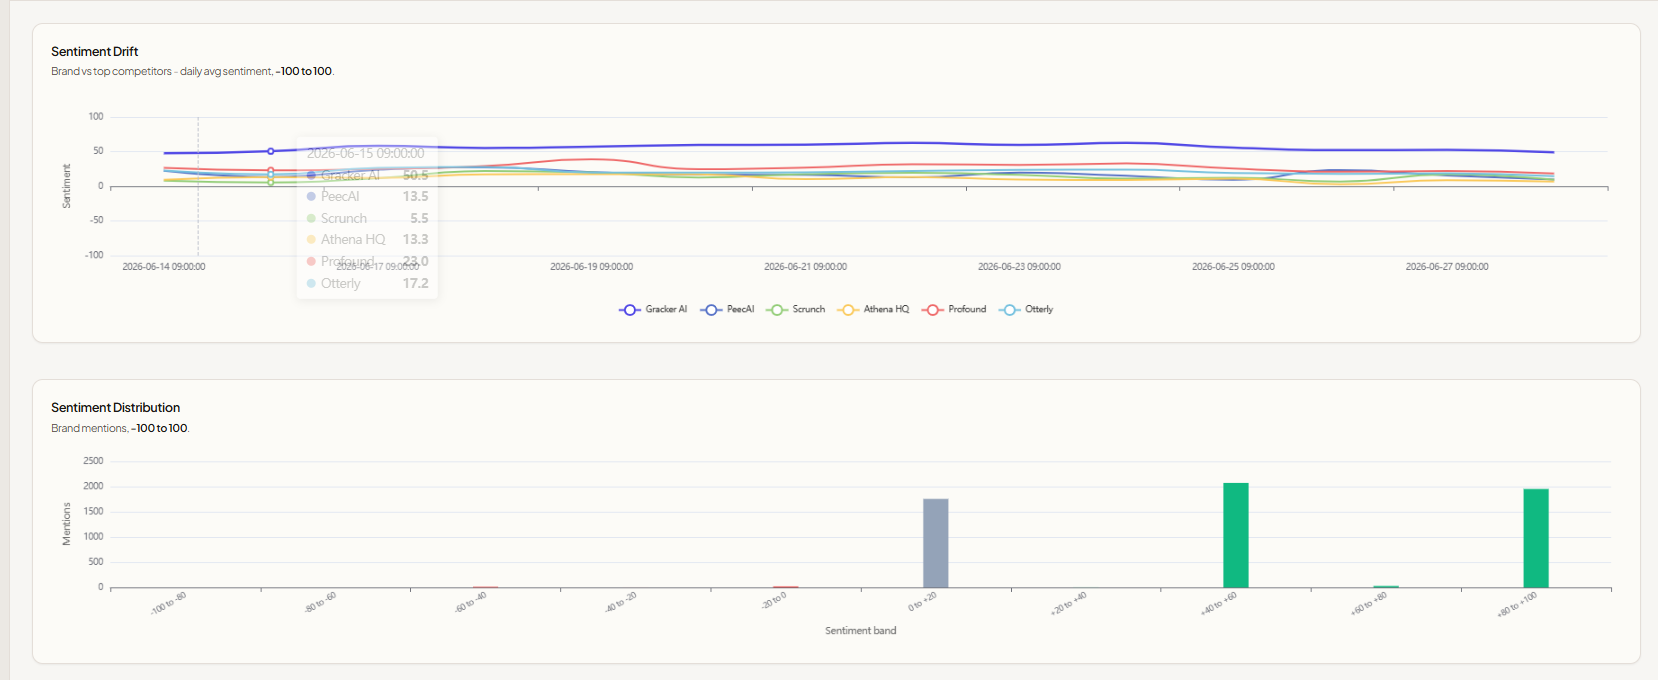
Sentiment score measures whether AI engines describe your brand positively, neutrally, or negatively when they mention you. It catches a failure mode that never existed in traditional SEO: an engine can cite you frequently and still frame you as expensive, hard to use, or inferior to a competitor.
What it measures: The tone of how AI engines characterize your brand in their answers.
How to calculate it: Classify each brand mention as positive, neutral, or negative, then compute a net score. A common approach is (positive mentions minus negative mentions) / total mentions, expressed from -100 to +100.
Target or benchmark: Aim for a net positive score with negatives under 10% of mentions. Investigate any recurring negative theme, since AI engines often echo a single unflattering third-party review across many answers.
7. Accuracy and Factual Consistency
Accuracy measures how often AI engines state correct facts about your brand: your pricing, your features, your positioning, and your scope. It is a quality KPI because a confident, frequently cited, but factually wrong description does more damage than no mention at all.
What it measures: The rate at which engines describe your product correctly versus with errors or hallucinations.
How to calculate it: Audit a sample of answers that mention you. Tag each factual claim as correct, outdated, or wrong. Accuracy = (correct claims / total claims about you) x 100.
Target or benchmark: Aim for 95% or higher. Anything lower means engines are circulating stale or invented facts, which usually traces back to thin, outdated, or poorly structured content on your own site. Tightening your structured data and schema markup is the most direct fix.
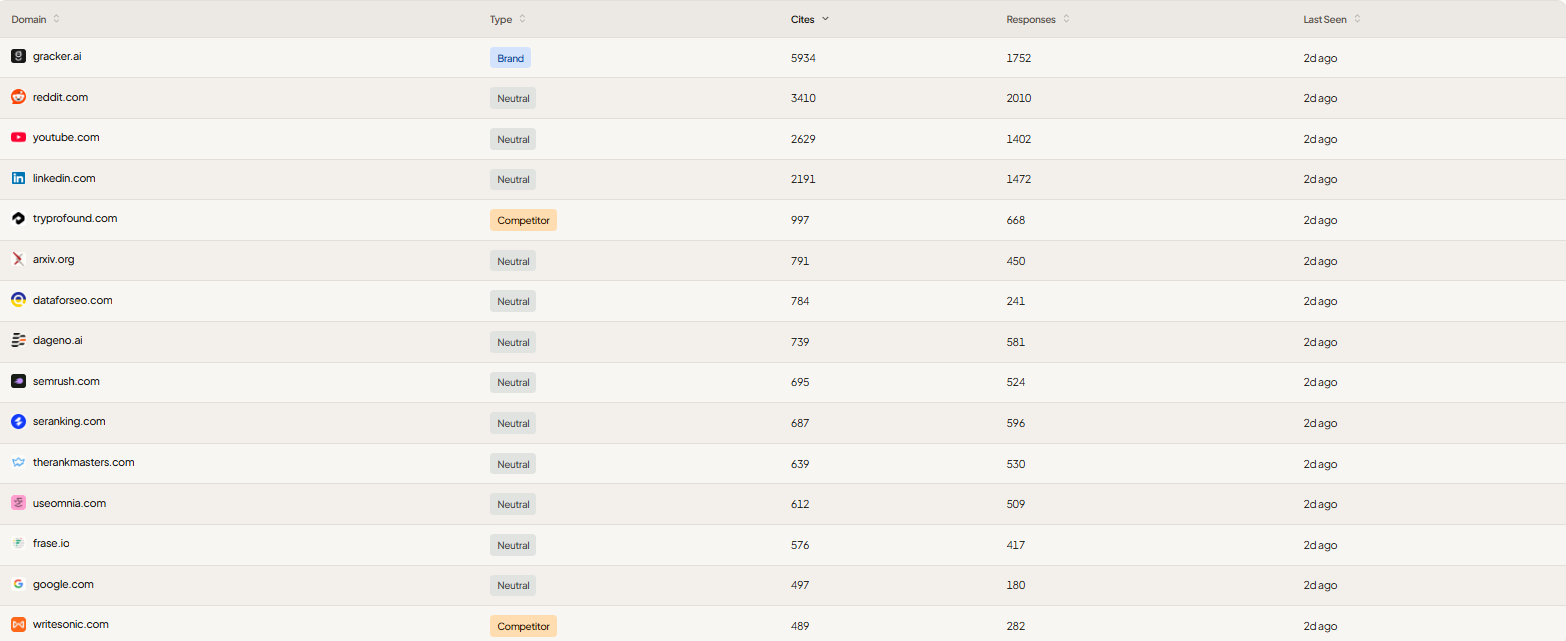
8. Source Citation Quality
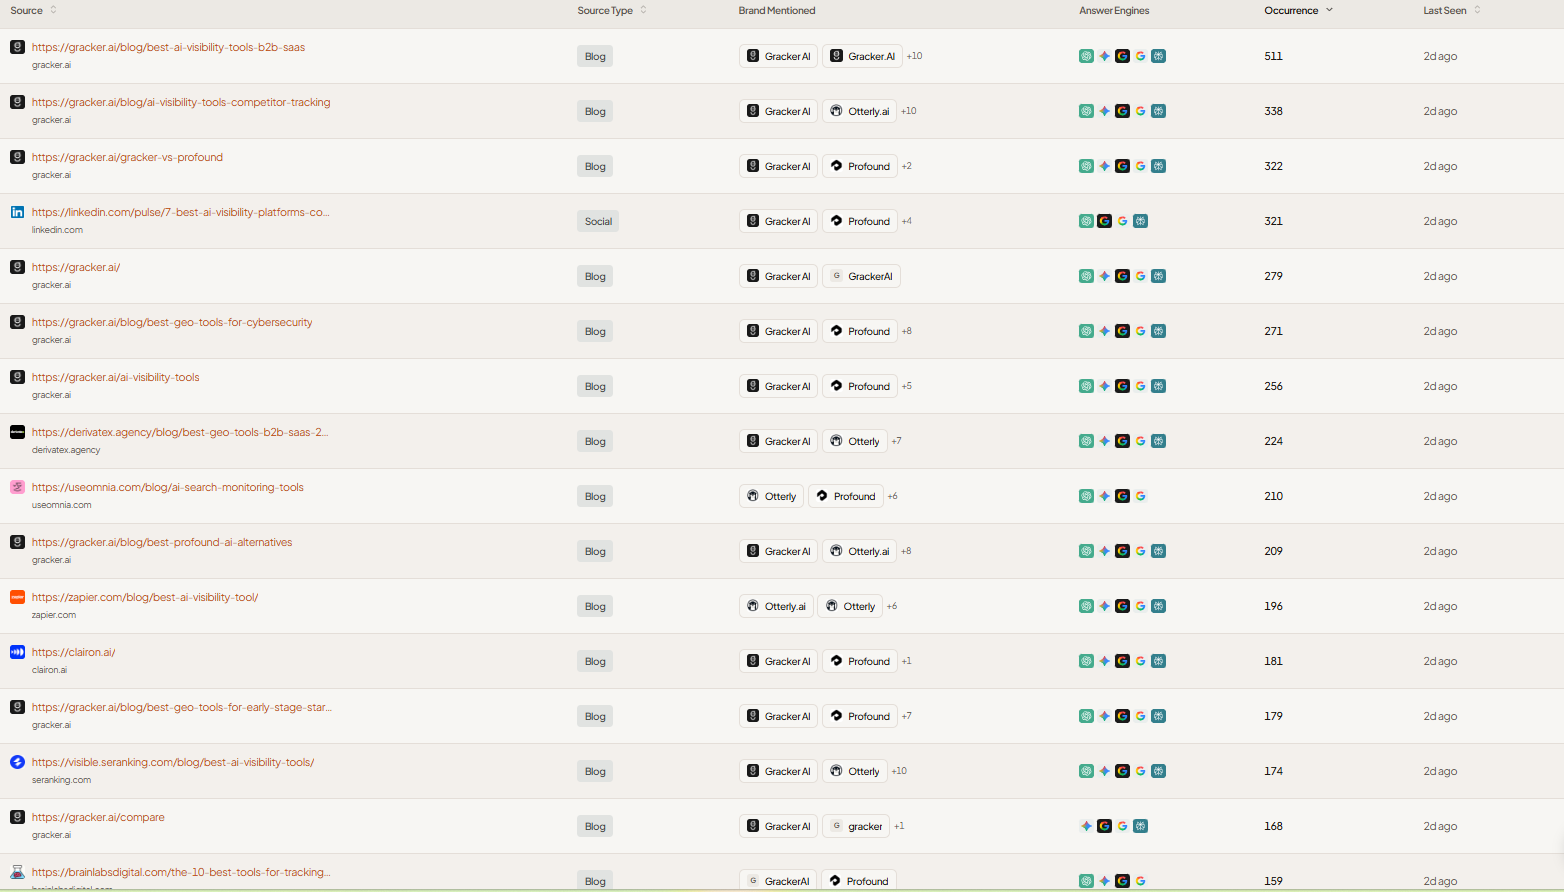
Source citation quality measures which of your pages and which third-party domains AI engines pull from when they cite information about you. It matters because the source shapes the framing, and a citation from a respected industry domain carries more weight with an engine than one from a low-authority page.
What it measures: The authority and relevance of the URLs that feed AI answers about your brand.
How to calculate it: For each citing answer, log the exact source URL. Group by your own domain versus third-party, and by domain authority tier. Track the share of citations coming from sources you control.
Target or benchmark: Increase the proportion of citations that point to your owned, current pages over time. When Pew Research Center (2025) analyzed Google AI Overviews, it found 88% cited three or more sources, so the practical goal is to be one of those three on every answer that matters.
9. Position Distribution (Hero to Tail)
Position distribution maps how your mentions spread across answer prominence tiers, from "Hero" mentions that open an answer to "Tail" mentions buried at the end. A single average position can look healthy while hiding a distribution where you are occasionally the hero and usually the tail.
What it measures: The full shape of your citation prominence, not just the mean.
How to calculate it: Bucket every citation into tiers (Hero, Body, Tail). Report the percentage in each tier rather than collapsing to one number.
Target or benchmark: Shift weight toward the Hero tier quarter over quarter. A healthy distribution has a growing Hero share and a shrinking Tail share, which signals engines are treating you as a primary answer rather than an afterthought.
10. AI-Referred Traffic
AI-referred traffic measures the sessions arriving on your site directly from AI engines and answer surfaces, separated from classic organic search. It is an outcome KPI because it is the closest direct-revenue signal in the GEO stack, even though it captures only the minority of buyers who actually click.
What it measures: Visits sourced from ChatGPT, Perplexity, Copilot, Gemini, and AI Overview referrals.
How to calculate it: Filter analytics referral traffic for known AI domains and user agents, then segment those sessions for conversion and engagement separately from organic. Connect Google Search Console data to ground the prompt side against real query data.
Target or benchmark: Watch the trend, not the absolute. Because Pew Research Center (2025) found only 8% of AI-summary users click any link, expect this number to stay small. Rising AI-referred traffic alongside rising citations is the signal that visibility is converting.
11. Competitor Gap Score
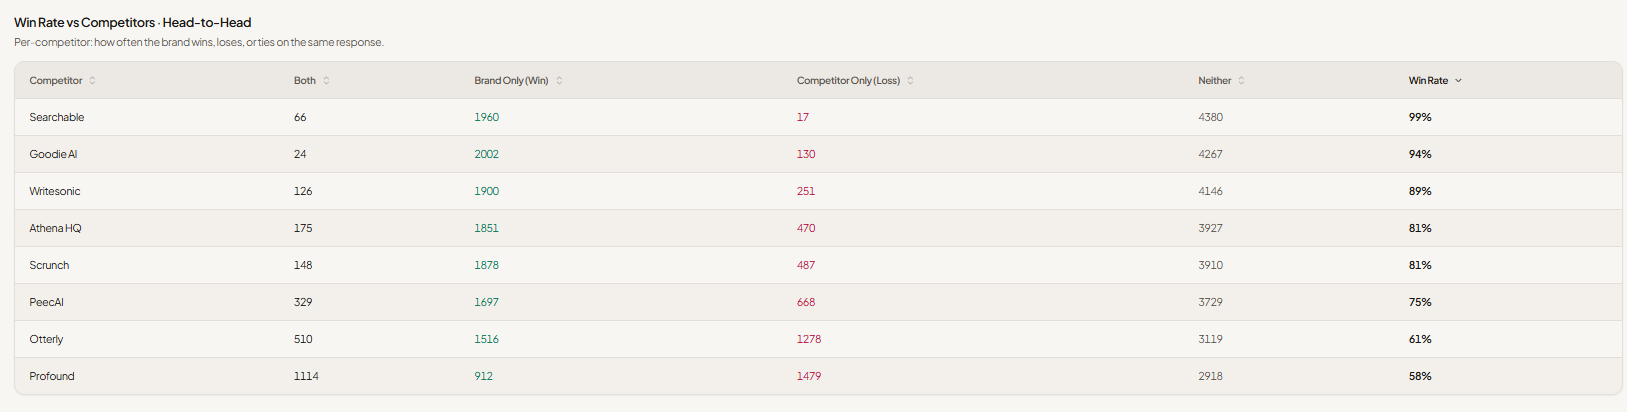
Competitor gap score measures the difference between your visibility KPIs and those of a named competitor across the same prompt set. It turns abstract SOV into a head-to-head scoreboard, which is what most executives actually want to see.
How does it differ from share of voice? SOV tells you your slice of the whole field. The gap score isolates one rival and quantifies exactly how far ahead or behind you sit on that specific competitor, prompt by prompt. You can lead on SOV overall and still lose badly to a single specialist on the ten prompts that drive your pipeline.
What it measures: Your delta against one competitor on coverage, SOV, and position.
How to calculate it: For a chosen competitor, subtract their value from yours on each visibility KPI. A positive gap means you lead; a negative gap is a prioritized target list.
Target or benchmark: Close negative gaps on your highest-intent prompts first. Our competitor comparison content guide walks through turning a negative gap into a content brief.
12. Visibility Trend and Velocity
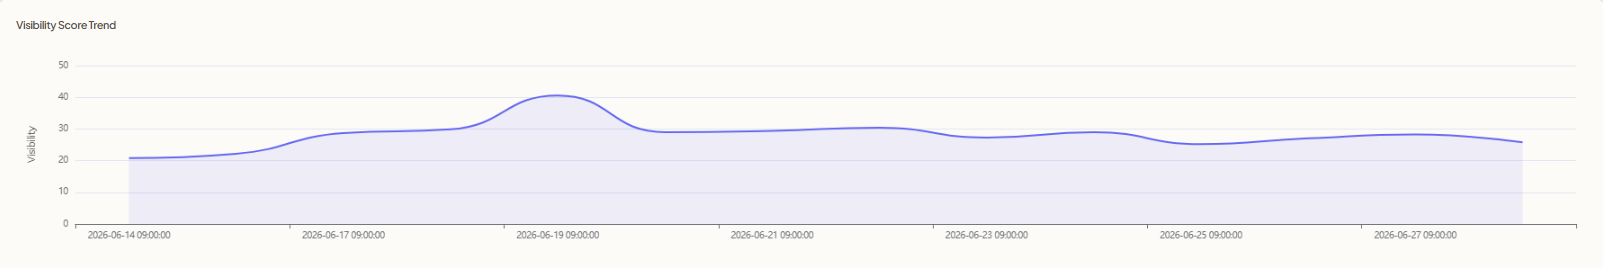
Visibility trend measures the rate of change in your core KPIs over time, not just their current value. Velocity is the outcome KPI that tells you whether your GEO program is working, because a mediocre absolute score that is climbing fast beats a strong score that is decaying.
What it measures: The slope and momentum of your SOV, citations, and coverage across reporting periods.
How to calculate it: Track each headline KPI as a time series. Compute period-over-period change and a rolling trend line so you can separate noise from real movement.
Target or benchmark: Aim for sustained positive velocity. A typical program shows initial visibility improvements in 4 to 6 weeks and meaningful citation gains in 2 to 3 months, so set review checkpoints on that cadence rather than expecting overnight jumps.
Want to see how AI search engines describe your brand today? Get your free AI visibility score in about 60 seconds, with no signup required. Trusted by 500+ security teams.
How Should You Prioritize These KPIs by Maturity Stage?
Prioritize by program maturity rather than trying to instrument all twelve at once. If you are just starting, track three KPIs: share of voice, citation frequency, and sentiment. Those three answer the only questions that matter early, which are whether you show up, how often, and whether the framing helps or hurts you.
If you have a baseline established, add the quality and breadth layer: prompt coverage, per-engine breakdown, accuracy, and average citation position. This is where you find the specific gaps that turn into a content roadmap.
If you are running a mature program with executive reporting, layer in the outcome KPIs: AI-referred traffic, competitor gap score, position distribution, and visibility velocity. These are the numbers that connect GEO work to pipeline and survive a board conversation.
Across every stage, ground your prompt set in real buyer queries by connecting Search Console and Bing Webmaster data, and revisit the set each quarter as buyer language shifts. For the broader strategy context, our main blog hub collects the playbooks behind each KPI.
Frequently Asked Questions
What is the most important GEO KPI to track first?
Share of voice is the most important GEO KPI to track first because it normalizes your visibility against your actual competitors instead of reporting a raw count. It answers the core question an executive asks: when buyers ask AI engines about our category, how often do we show up versus the other options. Start there, then add citation frequency and sentiment once you have a baseline.
How is GEO different from SEO measurement?
GEO measures citations, mentions, and sentiment inside AI-generated answers, while SEO measures rankings, clicks, and organic sessions on search results pages. The shift matters because AI engines serve synthesized answers rather than lists of links, so the click that SEO optimized for is disappearing. According to Pew Research Center (2025), only 8% of users clicked any link when a Google AI summary appeared, which is why GEO KPIs center on the mention rather than the click.
How do you calculate share of voice for AI search?
You calculate AI share of voice by running a fixed set of buyer prompts across your target engines, counting the answers that mention your brand, and dividing by the total brand mentions across you and all tracked competitors, then multiplying by 100. The result is the percentage of the AI conversation you own in that topic set. Keep the prompt set and competitor set fixed between reporting periods so the number stays comparable over time.
How often should you measure GEO KPIs?
Most teams measure core GEO KPIs weekly and report on them monthly, because AI engine answers change frequently as models and retrieval indexes update. Weekly tracking lets you attribute movement to specific content launches or competitor activity, while monthly reporting smooths out noise for stakeholders. Set program review checkpoints at 4 to 6 weeks for early signals and 2 to 3 months for meaningful citation gains.
Why does sentiment matter as a GEO KPI?
Sentiment matters because AI engines can cite your brand frequently and still describe it unfavorably, a failure mode that traditional ranking metrics never captured. An engine that consistently frames you as expensive or hard to use will suppress consideration even when your visibility looks strong. Tracking a sentiment score lets you catch and correct a recurring negative theme before it spreads across thousands of answers.
Final Thoughts
The KPIs that defined SEO are measuring a channel that is shrinking, and the ones that define GEO measure the channel that is replacing it. Pick three to start, instrument them against a fixed prompt set, and let the gaps you find write your content roadmap.