AEO/GEO Marketing Manager KPIs: What to Measure and How


Introduction
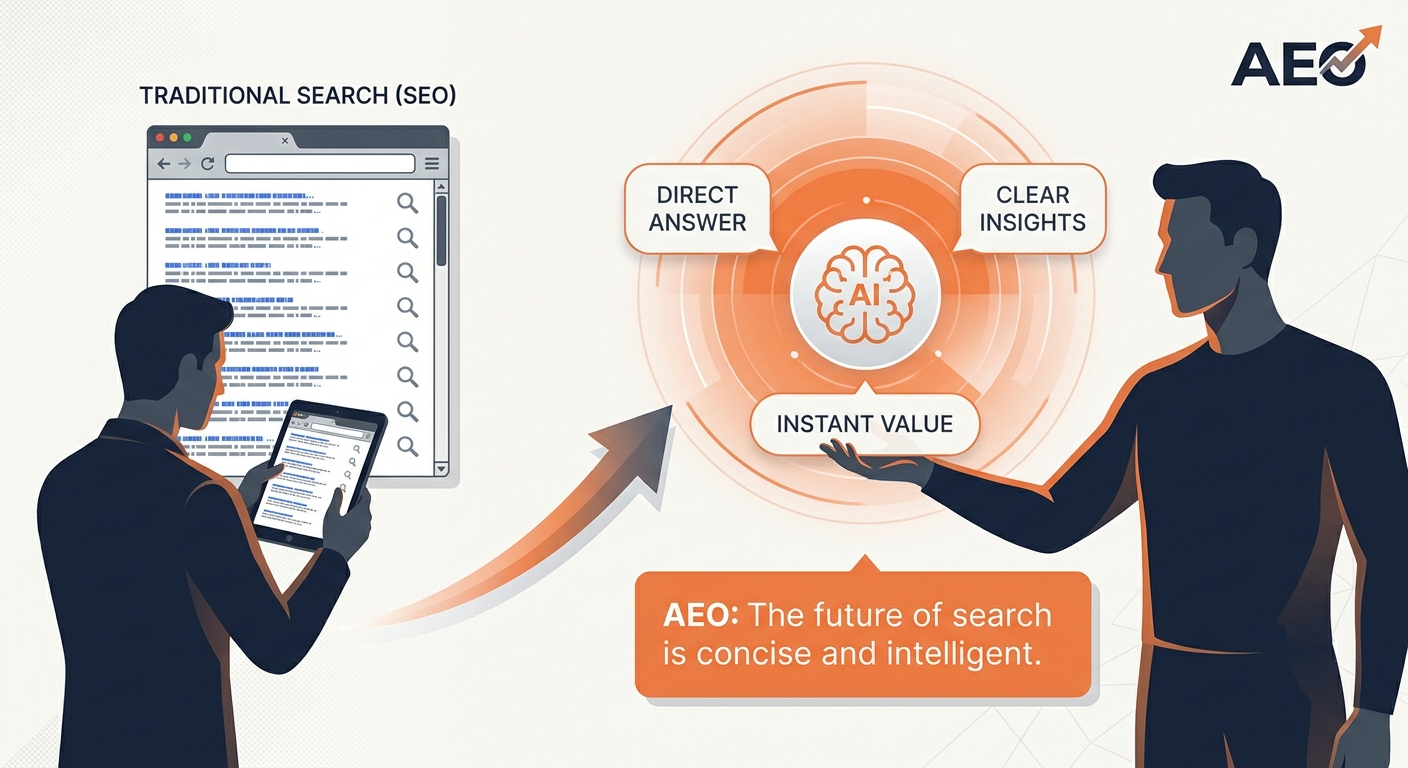
You cannot manage a channel you cannot measure, and AI search breaks most of the metrics marketers are used to. Rankings and organic clicks do not capture whether ChatGPT recommended you to a buyer who never clicked. This guide lays out the KPIs an AEO/GEO marketing manager should own, how to measure each one, and what a good result looks like, with a direct map from the SEO metrics you already know.
TL;DR
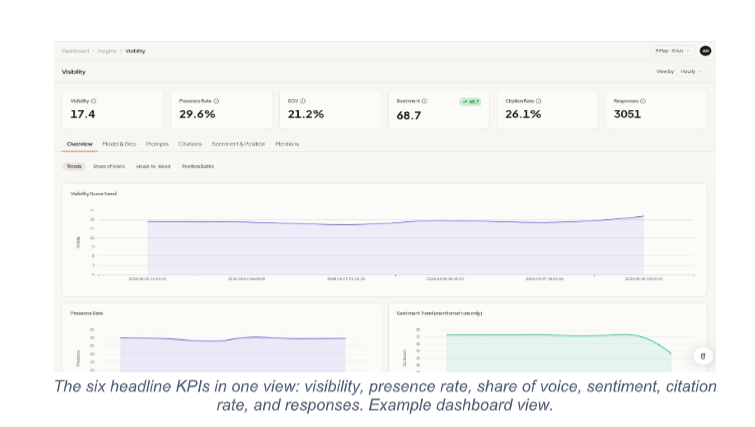
• The headline KPIs are visibility score, presence rate, share of voice, sentiment, citation rate, and AI-referred pipeline.
• Track every metric per engine. A blended number hides which engine and competitor is the real problem.
• Each AEO/GEO KPI has an SEO ancestor, so the shift is a translation, not a reset.
• Visibility is the number to move. Pipeline is the number that justifies the budget.
• Teams using a dedicated platform report around a 25 percent average visibility lift in 90 days. See your baseline with a free AI visibility score.
From SEO KPIs to AEO/GEO KPIs
Start from familiar ground. Almost every SEO metric has an AEO/GEO counterpart that measures the same idea against AI answers instead of Google's links.
SEO KPI | AEO/GEO KPI | What It Measures |
|---|---|---|
Keyword rankings | Visibility score | Your overall presence in AI results. |
Impressions | Presence rate | How often you show up at all. |
Share of search | Share of voice | Your slice versus competitors. |
Backlinks earned | Citation rate | How often you are cited as a source. |
Brand mentions | Sentiment | How you are described. |
Organic traffic and conversions | AI-referred pipeline | Revenue impact of the AI search channel. |
The KPI dictionary
Here is each metric in plain terms, how to measure it, and what a healthy result looks like. Treat the targets as starting points, since benchmarks vary by category and competition.
KPI | How to Measure It | What Good Looks Like |
|---|---|---|
Visibility Score | Composite of how often and how prominently AI answers feature you. | Rising month over month against your own baseline. |
Presence Rate | Share of relevant prompts where you appear at all. | Climbing toward and past your top competitor. |
Share of Voice | Your mentions as a percentage of all brand mentions on a prompt set. | Growing faster than rivals on priority prompts. |
Sentiment | Tone of how AI describes you, scored across answers. | Consistently positive and accurate. |
Citation Rate | How often answers cite your content as a source. | Up and to the right as optimized content lands. |
AI-Referred Pipeline | Traffic and assisted conversions from AI sources. | A growing, attributable share of pipeline. |
Why per-engine reporting beats a blended score
This is the mistake that quietly wrecks AEO/GEO reporting. A single average across engines feels tidy but hides the truth. You can look healthy overall while losing badly on the one engine your buyers actually use. The fix for one engine rarely transfers to another, so the work has to be diagnosed per engine.
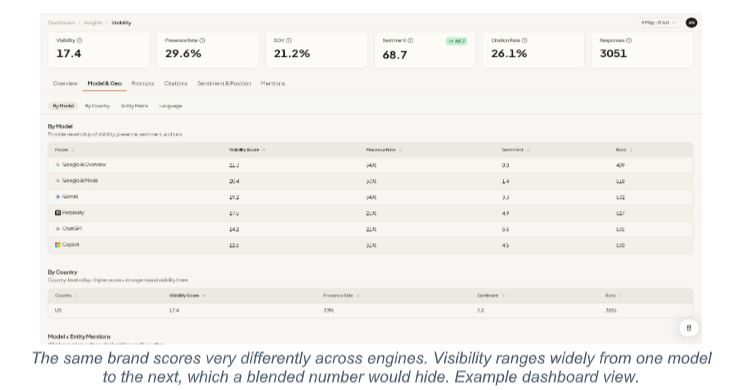
Read the example above. The visibility score is not one number, it is six, and they disagree. That spread is the actionable part. An AEO/GEO manager who reports only the average is hiding their biggest opportunities and risks.
Setting targets and the 90-day arc
New channels need realistic targets. In the first 90 days, aim to establish a clean baseline, move visibility on your priority prompts, and produce a per-engine report that ties to early pipeline signals. Teams using a dedicated platform commonly see around a 25 percent average visibility lift in that first quarter, alongside 20 to 35 percent more inbound leads as the channel matures. Use those as a sanity check, not a guarantee, since your category and starting point shape the curve.
Common KPI mistakes to avoid
• Reporting a single blended score and hiding per-engine weakness.
• Measuring traffic only, when many AI answers convert without a click.
• Chasing presence on low intent prompts that never drive pipeline.
• Ignoring sentiment, so you are visible but described inaccurately.
• Treating citation rate as vanity rather than the lever that compounds.
How GrackerAI tracks these KPIs
Every metric above is a native view in GrackerAI: a single AI Visibility Score over time, LLM citation tracking, brand sentiment, and AI search analytics that ties visibility to pipeline, all broken out per engine for cybersecurity and B2B SaaS. That per-engine breakout is the part generic tools miss.
Get your numbers first. Run a free AI visibility score in about a minute and you have a baseline for every KPI on this page.
Frequently asked questions
What are the most important AEO/GEO KPIs?
Visibility score and share of voice tell you how you are doing, citation rate is the lever that improves them, sentiment guards accuracy, and AI-referred pipeline proves the channel's value. Track all of them per engine.
How is AEO/GEO measurement different from SEO?
SEO measures rankings and clicks on one engine. AEO/GEO measures citations and recommendations across many engines, and accounts for buyers who form opinions inside an answer without ever clicking.
Should I use one combined visibility score?
Use it only as a headline. Decisions should be made on per-engine data, because a blended number hides which engine and competitor needs attention.
How long until KPIs improve?
Expect a clean baseline in month one, early movement by month two, and a measurable lift by month three. It compounds, so consistency beats intensity.
Conclusion
The right AEO/GEO KPIs are not exotic. They are the familiar SEO metrics pointed at AI answers: visibility, presence, share of voice, sentiment, citation rate, and pipeline. Measure them honestly, always per engine, and you turn a fuzzy new channel into something you can manage and defend.
Ready to baseline? Check your free AI visibility score and start tracking the metrics that matter.